

雅思图表写作真题08 9分范文
【考研英语一/二、大英赛、BEC,皆可参考学习!】
08 1975-2005年五国税收占GDP比例变化
IELTS A Task1〔动态图· 表格〕
【后文精美高清图片呈现范文,可直接下载】
请在微信客户端打开
Para.1
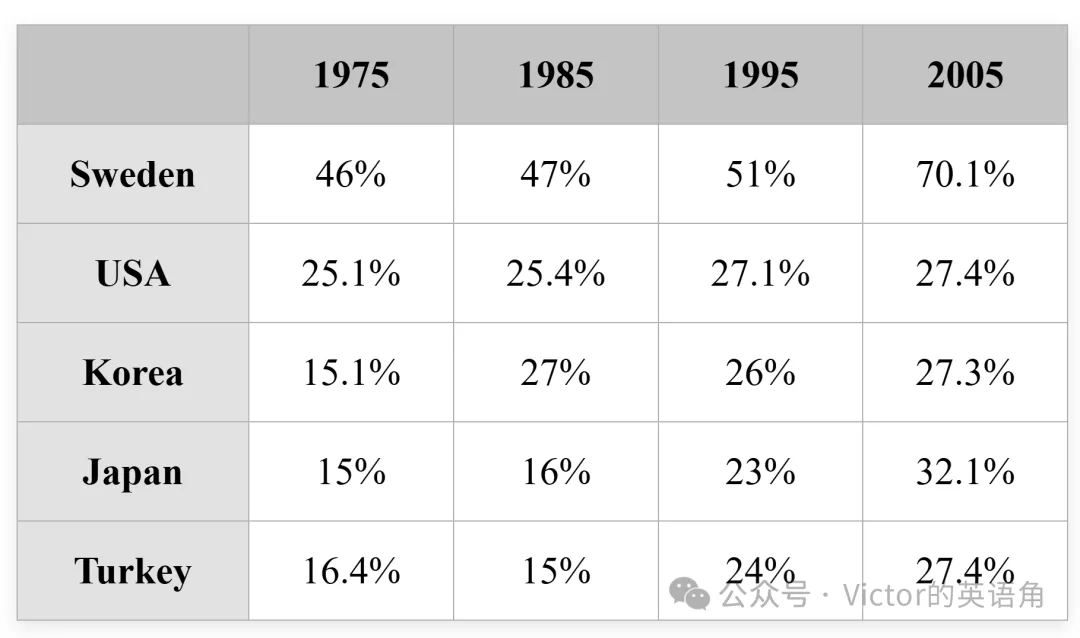
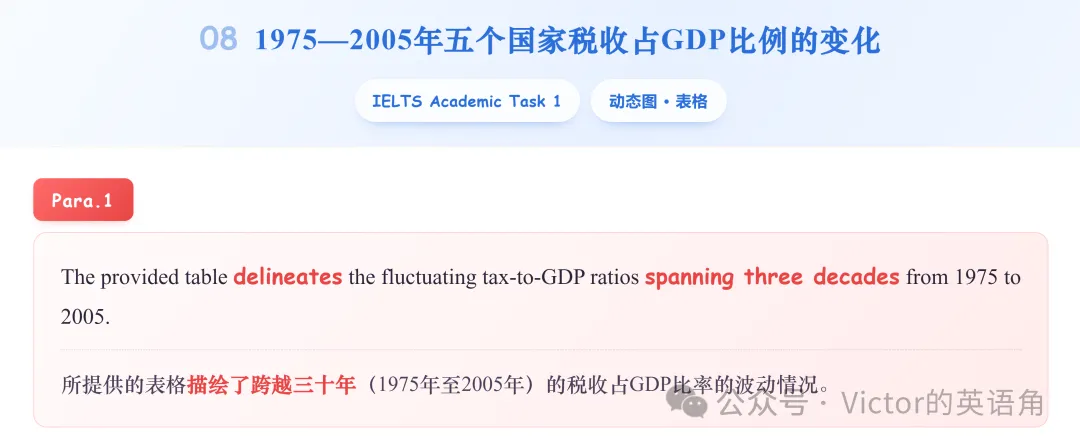
The provided table delineates the fluctuating tax-to-GDP ratios spanning three decades from 1975 to 2005.
所提供的表格描绘了跨越三十年(1975年至2005年)的税收占GDP比率的波动情况。
Para.2
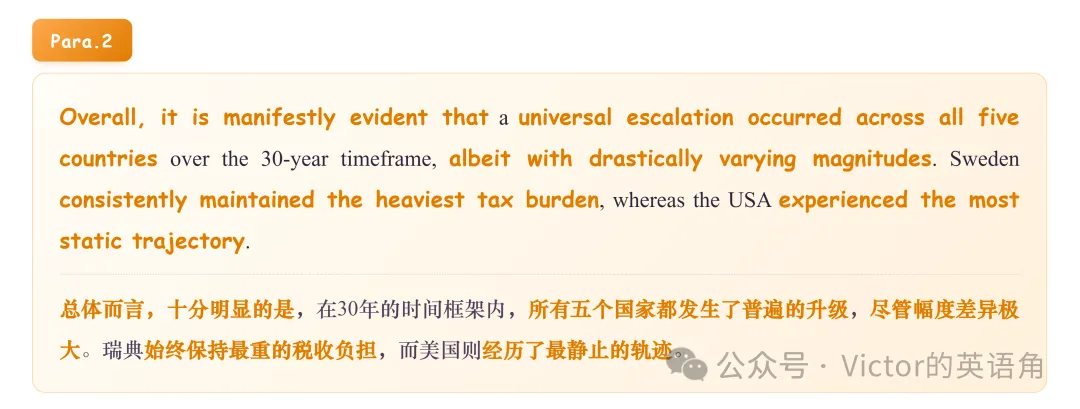
Overall, it is manifestly evident that a universal escalation occurred across all five countries over the 30-year timeframe, albeit with drastically varying magnitudes. Sweden consistently maintained the heaviest tax burden, whereas the USA experienced the most static trajectory.
总体而言,十分明显的是,在30年的时间框架内,所有五个国家都发生了普遍的升级,尽管幅度差异极大。瑞典始终保持最重的税收负担,而美国则经历了最静止的轨迹。
请在微信客户端打开
Para.3
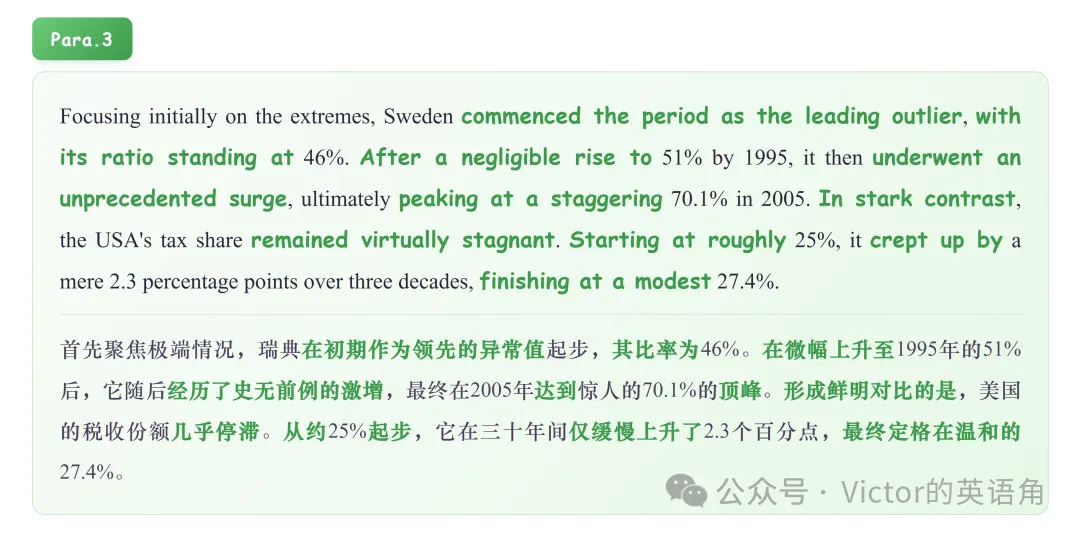
Focusing initially on the extremes, Sweden commenced the period as the leading outlier, with its ratio standing at 46%. After a negligible rise to 51% by 1995, it then underwent an unprecedented surge, ultimately peaking at a staggering 70.1% in 2005. In stark contrast, the USA's tax share remained virtually stagnant. Starting at roughly 25%, it crept up by a mere 2.3 percentage points over three decades, finishing at a modest 27.4%.
首先聚焦极端情况,瑞典在初期作为领先的异常值起步,其比率为46%。在微幅上升至1995年的51%后,它随后经历了史无前例的激增,最终在2005年达到惊人的70.1%的顶峰。形成鲜明对比的是,美国的税收份额几乎停滞。从约25%起步,它在三十年间仅缓慢上升了2.3个百分点,最终定格在温和的27.4%。
Para.4
Turning to the remaining three nations, their baseline figures in 1975 were tightly clustered near the 15% mark. Japan experienced the most dramatic proportional leap, expanding its ratio by more than twofold from an initial 15% to reach 32.1%. Korea, meanwhile, witnessed a highly volatile progression, jumping sharply to 27% in 1985 before briefly dipping, and then recovering to settle at 27.3%. Similarly, Turkey's ratio initially contracted to 15% in 1985, yet it subsequently rebounded robustly, ultimately converging with both Korea and the USA at approximately 27.4% by the end of the period.
转向其余三个国家,它们在1975年的基线数据紧密聚集在15%大关附近。日本经历了最戏剧性的比例跨越,其比率扩张了两倍多,从最初的15%达到32.1%。与此同时,韩国见证了高度波动的演进过程,在1985年急剧跃升至27%,随后短暂下降,然后复苏并稳定在27.3%。同样,土耳其的比率最初在1985年收缩至15%,但随后强劲反弹,最终在期末与韩国和美国汇聚在约27.4%的水平。
请在微信客户端打开
创作不易,恳请多多支持:
点赞 + 转发 + 小红心
觉得有帮助的话,可以给作者打个赏哦~
▼英语学习公众号分享▼
关注WeChat #公众号:Victor的英语角
【Victor老师是谁?】
√ 深耕英语教学,现任雅思教学讲师,兼任四六级提分讲师、高考英语讲师
√ 独创各大题型「结构化拆解」教学法,帮助学员建立系统备考路径
√ 覆盖雅思听说读写全科/词汇语法/口语/学术写作/四六级高分冲刺等
🎁高分资料
✓ 雅思大作文万能论证框架
✓ 雅思口语/写作高频短语句型、万能精彩素材
✓ 阅读判断题/匹配题答题方法 + 听力信号词定位技巧
🎁公众号日常推文
✓ 雅思口写表达积累、精彩范文整理
✓ 口语Part 2/Part 3素材与作答框架
✓ 写作Task 1/Task 2素材与作答框架
✓ 剑桥雅思真题、模拟题精析
▼没有华而不实的资料,只有可复用的备考方法▼
📚学习资源1.《高分妙法核心讲义》
→ 适配:雅思全科/单项备考。正课讲义不对外出售
→ 拆解阅读「关键词定位三步法」「同义替换四类线索」「判断题正向排除逻辑」、Heading「段落逻辑追踪法」、听力「信号词三步走」等
→ 步骤化+结构化解题,覆盖雅思主要题型底层逻辑与思维模型
2.《高分写作底层逻辑》
→ 适配:
1)雅思写作A类Task 1 、考研英语一、二图表作文
2)雅思写作G类Task 1、考研英语一、二/高考应用文写作
3)雅思写作Task 2、四六级议论文
正课讲义不对外出售
→ 「长难句九阴真经」「双飞人写作法」「八仙过海短语写作法」夯实写作基础
→ 附【Task 1图表/书信专项】【Task 2议论文专项】
请在微信客户端打开
🌟教学理念:
用考官思维审题,用评分标准写作;
无序中找规律,方法中提效率。
🌟咨询方式:请于公众号后台留言,或添加个人账号VictorValerio230816 咨询(课程咨询、备考规划、学习疑问均可)
请在微信客户端打开